Wind Farm Site Analysis
Combines global-model wind speeds, global wave heights and a local buoy's time series to decide whether a site can host an offshore wind farm, then plots the evidence in a single summary figure.
- Stack
- MATLABData AnalysisData VisualizationUnit Testing
- Highlights
- Five-constraint site evaluation from three datasets
- Wave-height risk measured from buoy time-series data
- Five-panel summary figure of maps, histogram and time series
The problem
An offshore wind farm needs wind that's strong but not destructive, and waves low enough to build and maintain in. Deciding on a site means checking one location against several datasets at once.
Approach
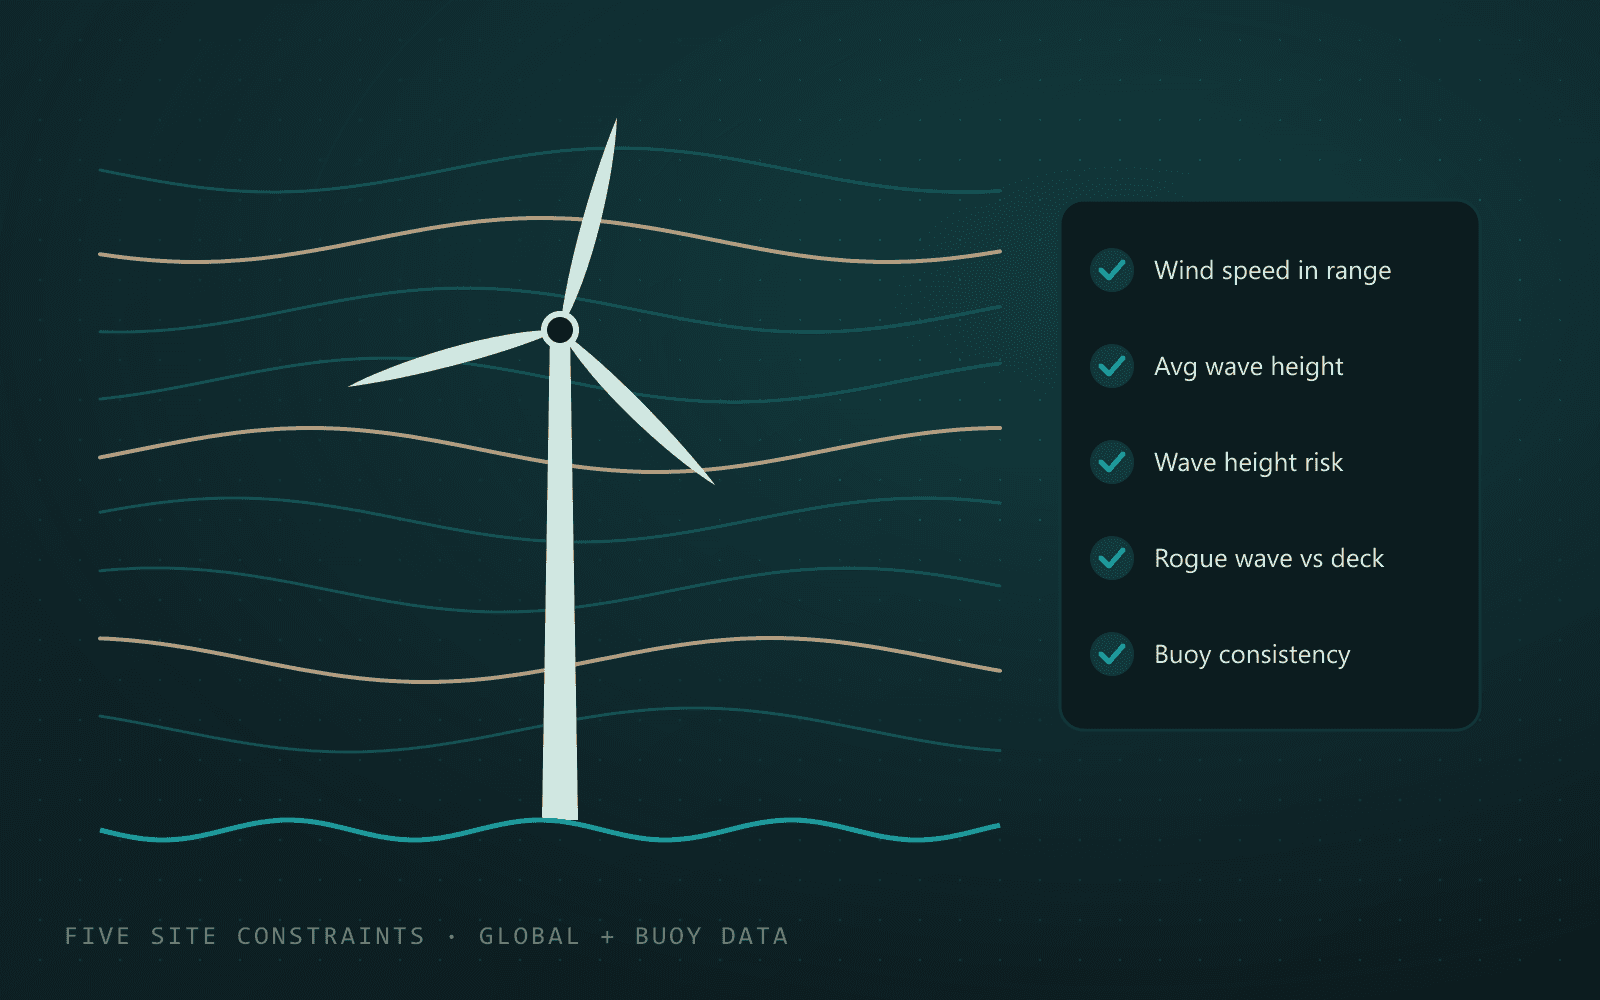
Five constraints. A site has to pass all of these:
- Average wind speed within the turbines' working range.
- Average wave height under a safe maximum.
- Waves under that maximum for enough of the time, measured from the buoy's readings.
- Every rogue wave staying below the platform deck.
- Wave heights steady enough that their spread stays small relative to the average.
Global versus local. Global model averages suggest where to look, and the buoy's hourly measurements show what actually happens at the site. The analysis uses both and compares them directly.
One figure. The results are plotted together: global wind and wave maps, the candidate-site mask with the chosen location marked, a histogram of buoy wave heights, and the buoy readings against the global average over time.